Monte Carlo analysis seems amazing

Posted By: dusktrader

Monte Carlo analysis seems amazing - 04/25/14 14:28

This feature is amazing. It's so simple and fast that it seems too good to be true.

Can you please answer a few questions I have so far:
I see that the simulations are random. Is it possible then that there could be a situation where the reported values could change between tests? I would think this is a Yes, but possibly only noticeable if the # of simulations were very small. For example I have my # of simulations set very high at 2000. It seems that, in a given random sampling, the outcome would tend towards the same result as the # of simulations increase. And this would then be reflective of the real-world expected performance of the trade logic.

Where is the Median AR% figure coming from? That number doesn't seem to change if I increase the # of simulations. I don't think that comes from the 50% confidence level. What is the usefulness of knowing the Median AR% figure? Personally I want to look at the most realistic outcome, about 95%

THANKS
Posted By: jcl

Re: Monte Carlo analysis seems amazing - 04/25/14 17:01

The values don't change between tests because a special random sequence is used that is always the same. Otherwise there would be indeed small changes between tests.

The median AR is the AR at 50% confidence level, i.e. 50% of results are worse and 50% are better. It _is_ the most likely outcome, and also useful for comparison with the 'real' AR. A real AR that is always better or worse than the median AR reveals some information about the system, f.i. a negative or positive self-correlation of the results.

The AR at 95% is not the most realistic AR, it only means that 95% of results get this _or_ a better AR.
Posted By: dusktrader

Re: Monte Carlo analysis seems amazing - 04/25/14 18:27

Thanks for explaining that. It makes sense.

I did not state that correctly above when I said "I want to look at the most realistic outcome" -- my actual feeling is more like this:

I want to look at a statistically probable outcome that is heavily pessimistically skewed, about 95%. That way, I am setting my expectations in a very conservative way. It will also highlight problems quicker if my real-life outcome is not at least as profitable on average.
Posted By: dusktrader

Re: Monte Carlo analysis seems amazing - 04/29/14 14:18

I'm starting to get confused by the Monte Carlo analysis figures. I think the only value that changes in the Zorro window, as well as the Performance Report is the AR% (or CAGR%)

Would it be possible to see all the metrics adjusted by the Monte Carlo analysis? I'm specifically interested to see a highly-pessimistic result, including things like the monthly average profit, for example.

Ideally I think if MonteCarlo and Confidence are not set (or default), then you should show the report as it is currently. If they are set, then you should reflect all metrics based on that MonteCarlo analysis.

Thanks
Posted By: jcl

Re: Monte Carlo analysis seems amazing - 04/29/14 15:50

That's already so.
Posted By: dusktrader

Re: Monte Carlo analysis seems amazing - 04/29/14 15:56

Hmm... well as a disclaimer I did say I was "getting confused" so maybe this means I already "am confused" LOL. I am doing a Train now, but when that's done I'll go back and re-Test with and without the MonteCarlo settings. If there seems to be a discrepancy I'll post back here.

THANKS

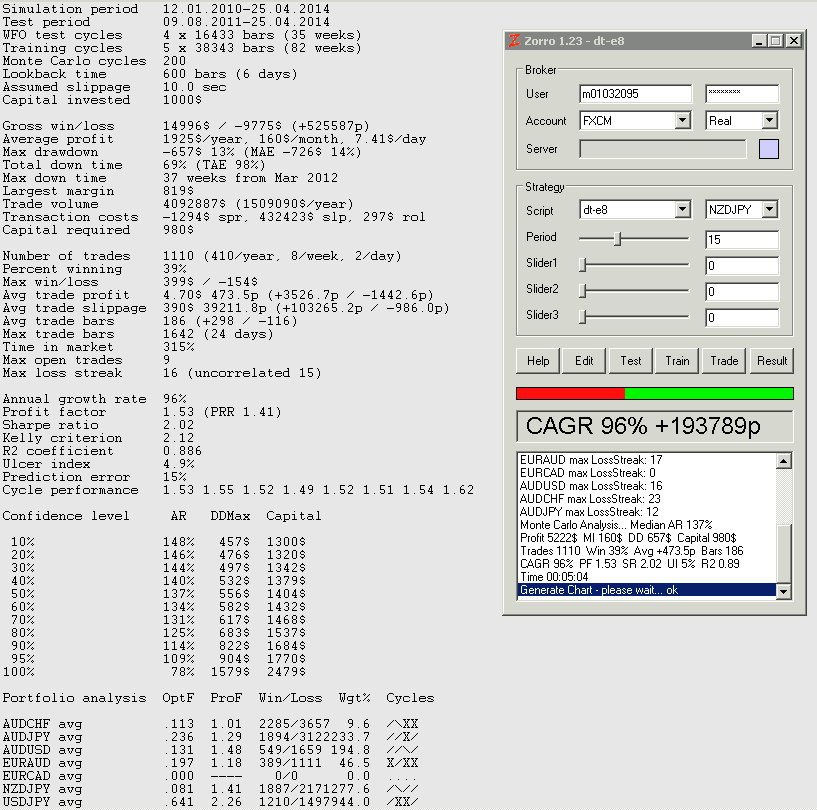
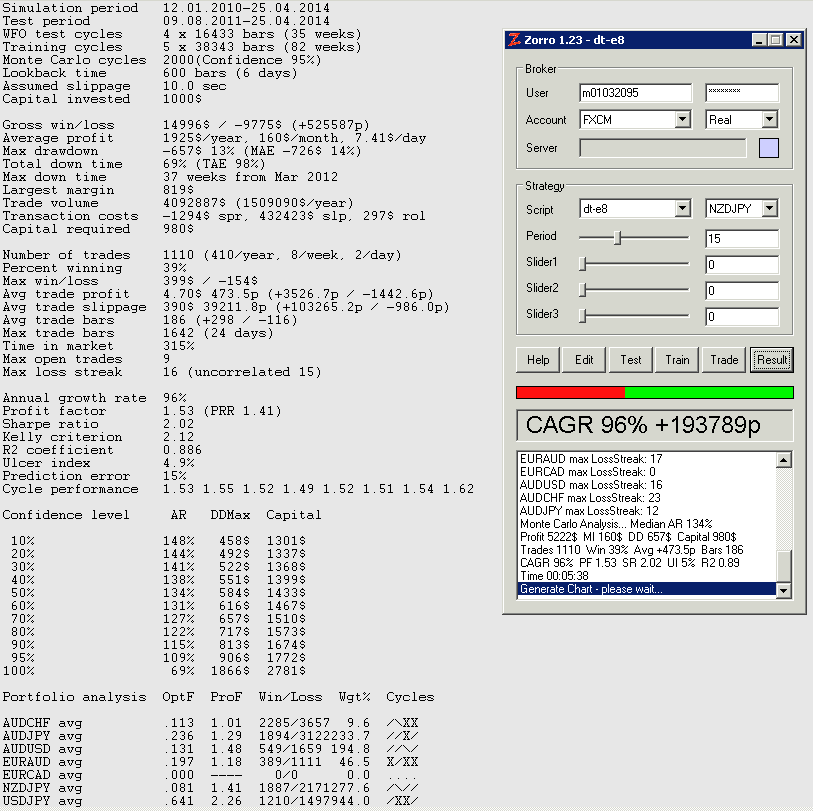
Ok I did a side-by-side comparison. Does this look correct? I would like the metrics to all reflect the results at the chosen Confidence level, if possible.

The only difference between these 2 tests is that in the one "with-montecarlo" I've added these two lines in the script:
MonteCarlo = 2000;
Confidence = 95;


Attached picture no-montecarlo.png
Attached picture with-montecarlo.png
Posted By: GPEngine

Re: Monte Carlo analysis seems amazing - 05/05/14 03:32

Monte Carlo is amazing.
Nice job!
Posted By: jcl

Re: Monte Carlo analysis seems amazing - 05/05/14 10:37

Dusktrader: Monte Carlo analysis is used for calculating performance figures from the equity curve, such as annual return, drawdown, etc. For calculating them you must not set the Capital variable, because then the figures are based on your invested capital, not on the equity curve (I think).
© 2024 lite-C Forums