Posted By: gamadeus
Equity Curve not Showing in Chart Viewer (v1.96) - 11/27/18 18:47
This might be a newbie question, but I wonder how I get the equity curve to show up in the Chart Viewer behind the price chart?
It seems that ever since upgrading to version 1.96 it is only displayed for BarPeriods of 240 or higher, not on smaller timeframes, which is weird.
ColorEquity or other variables also seem to have no effect.
Has anybody experienced something similar and/or knows a solution?
Posted By: jcl
Re: Equity Curve not Showing in Chart Viewer (v1.96) - 11/28/18 12:16
Posted By: gamadeus
Re: Equity Curve not Showing in Chart Viewer (v1.96) - 11/28/18 18:34
I dont have Zorro S, so my chart viewer outputs just an image file with no buttons to interact with.
Or did I mistunderstand something there?
Posted By: jcl
Re: Equity Curve not Showing in Chart Viewer (v1.96) - 11/29/18 09:56
The equity curve is displayed on any timeframe. So if it's not the button, then it's something else in your script that prevents displaying it.
Posted By: MutilatedDuck
Re: Equity Curve not Showing in Chart Viewer (v1.96) - 11/29/18 16:47
It's displaying for some scripts and not others. No idea what makes the difference.
Posted By: gamadeus
Re: Equity Curve not Showing in Chart Viewer (v1.96) - 11/29/18 16:51
It has nothing to do with my script.
For example, I can take the Workshop 5 script and simply change BarPeriod to 60 or below to make it disappear.
Also I noticed that the euqity curve (when it is displayed) looks different in 1.96. It has the shape of a histogram rather than a curve. Maybe that is related?
Posted By: jcl
Re: Equity Curve not Showing in Chart Viewer (v1.96) - 11/29/18 17:23
Yes, it looks different, but no, I cannot confirm any problem with the equity curve of workshop 4. For making it look as in the old version, set the PL_FINE flag in PlotMode.
Can you post here the chart that you get with an _unchanged_ workshop 4 with BarPeriod at 60 and EUR/USD?
Posted By: AndrewAMD
Re: Equity Curve not Showing in Chart Viewer (v1.96) - 11/29/18 17:29
Question: Did you remember to
Train your script?
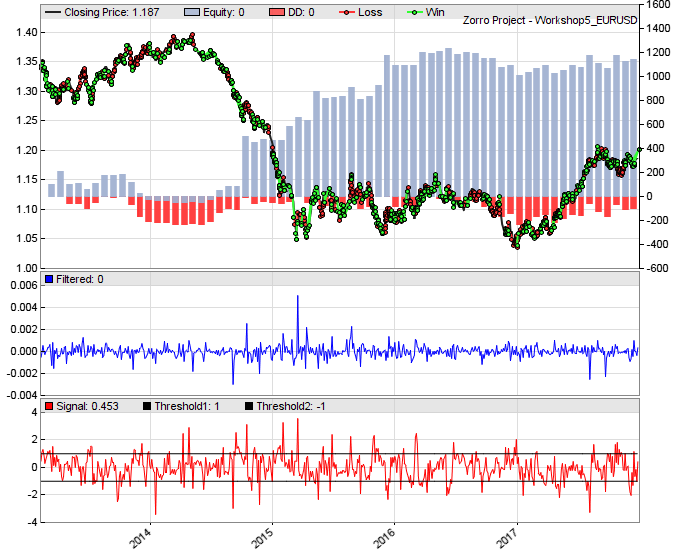
For reference, I disabled Zorro S, and this is what my Workshop 5 plot looks like with BarPeriod at 30.

Posted By: gamadeus
Re: Equity Curve not Showing in Chart Viewer (v1.96) - 11/29/18 17:46
Interestingly it seems to have to do with the PLOTNOW flag. if that is enabled, then I see the equity curve, if not then it looks like this:

Posted By: AndrewAMD
Re: Equity Curve not Showing in Chart Viewer (v1.96) - 11/29/18 18:19
Interestingly it seems to have to do with the PLOTNOW flag. if that is enabled, then I see the equity curve, if not then it looks like this:
I get the equity curve in both cases (with the click of [Result] when PLOTNOW is disabled).
Posted By: gamadeus
Re: Equity Curve not Showing in Chart Viewer (v1.96) - 11/29/18 20:11
Ok also playing around with PlotMode does not help. Equity is simply not displayed when I click [Result] for BarPeriods below 240, which is really strange.
Anyway, as long as PLOTNOW works I am good.
Posted By: jcl
Re: Equity Curve not Showing in Chart Viewer (v1.96) - 12/01/18 08:29
I see that the equity curve is normally not displayed when it was negative at the end of the simulation. Maybe that was the problem? The workshops all display equity curves regardless of PLOTNOW, unless you've modified the system so that the equity is negative. Anyway we'll change this so that also negative equity curves are displayed.
Posted By: gamadeus
Re: Equity Curve not Showing in Chart Viewer (v1.96) - 12/02/18 18:31
Yes exactly thats the problem. It only occurs when I decrease the timeframe, which renders the strategy unprofitable.
Thanks for taking care of this, in the interim I know how to work with it.