Posted By: laz
Changing "LookBack" produces completely different results? - 02/19/19 16:38
Hello everybody, I am currently testing an example from the following link:
https://robotwealth.com/getting-started-neural-networks-algorithmic-trading/
I adjusted the script
and was surprised by the results.
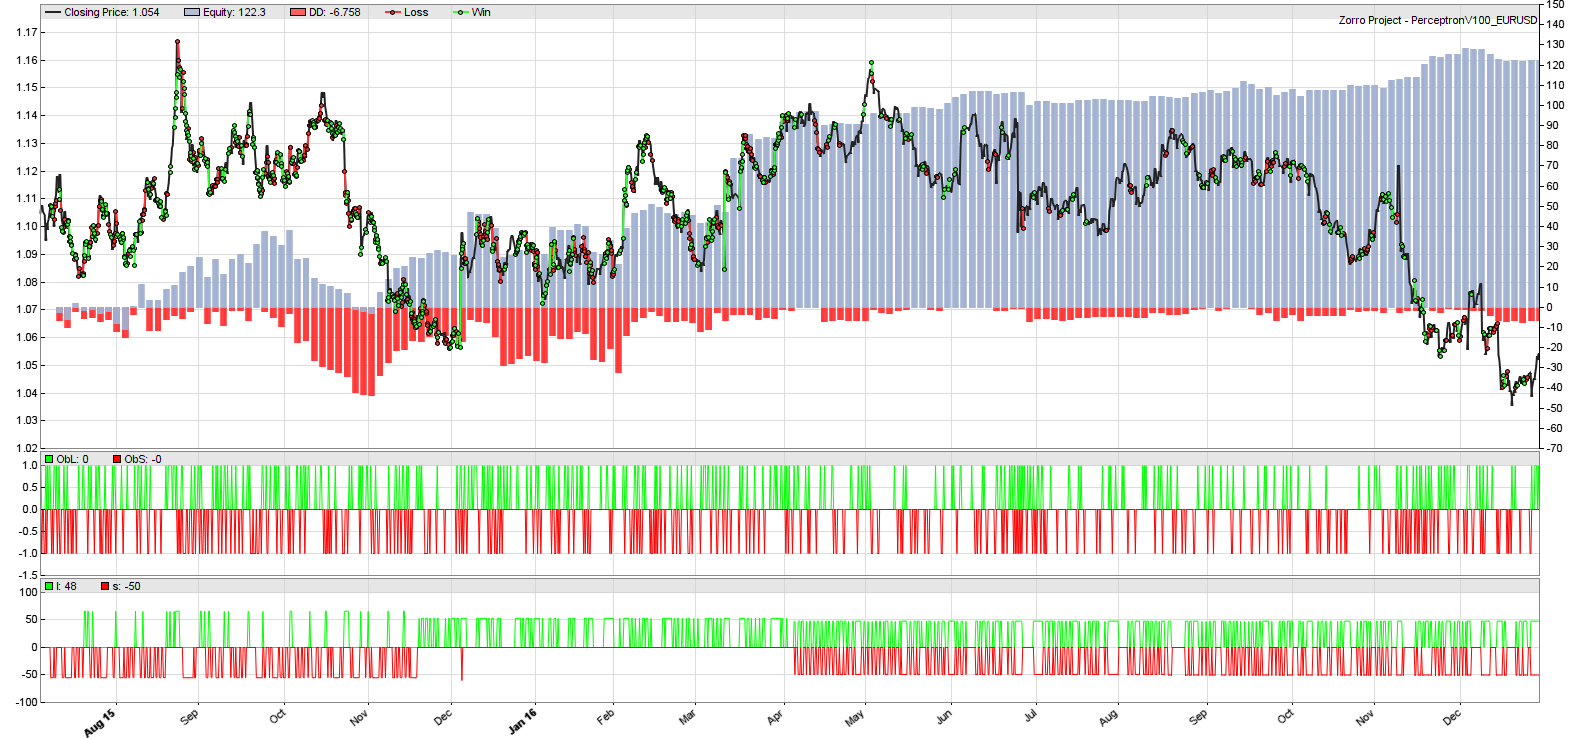
But if you change "LookBack" from 100 to 200, the result changes drastically:
The Trades / Signals (Output) of the Perceptron are also very different.
Why is that?


https://robotwealth.com/getting-started-neural-networks-algorithmic-trading/
I adjusted the script
Code:
function run() {

	set(RULES|PEEK|OPENEND|TESTNOW|PLOTNOW|LOGFILE);

	StartDate    = 2014;
	EndDate      = 2016;
	BarPeriod    = 60;
	LookBack     = 100;

	NumWFOCycles = 5;
	DataSplit    = 80;

	if(Train) Hedge = 2;

	MaxBars      = slider(2,0,0,100000,"MaxBars","MaxBars");
	PlotWidth    = slider(3,1500,1500,10000,"PlotWidth","PlotWidth");

	asset("EURUSD");

	Spread = Commission = Slippage = RollLong = RollShort = 0;

	vars Close = series(priceClose());
	var  Sig1  = scale(ATR(10)-ATR(50), 100);
	var  Sig2  = (Close[0]-Close[1])/Close[1];
	var  Sig3  = (Close[0]-Close[5])/Close[5];
	var  Sig4  = (Close[0]-Close[10])/Close[10];

	var  ObL   = -1;
	var  ObS   = -1;

	if(priceClose(-5) - priceClose(0) >  20*PIP) ObL = 1;
	if(priceClose(-5) - priceClose(0) < -20*PIP) ObS = 1;

	LifeTime = 5;

	var l = adviseLong (PERCEPTRON+BALANCED, ObL , Sig1, Sig2, Sig3, Sig4);
	var s = adviseShort(PERCEPTRON+BALANCED, ObS , Sig1, Sig2, Sig3, Sig4);

	if(!Train) {

		if(l > 0 and s < 0) reverseLong(1); else
		if(s > 0 and l < 0) reverseShort(1);

	}

	ObL = ifelse(ObL>0,ObL,0);
	ObS = ifelse(ObS>0,ObS,0);

	l = ifelse(l>0,l,0);
	s = ifelse(s>0,s,0);

   plot("ObL", ObL, NEW, GREEN);
	plot("ObS",-ObS, 0, RED);

	plot("l", l, NEW, GREEN);
	plot("s",-s, 0, RED);

}
and was surprised by the results.
Quote:
WFA Test PerceptronV100 EURUSD
Simulated account AssetsFix
Bar period 1 hour (avg 86 min)
Simulation period 2014-01-08..2016-12-30 (18208 bars)
Test period 2015-07-06..2016-12-30 (9105 bars)
Lookback period 100 bars (4 days)
WFO test cycles 4 x 2276 bars (19 weeks)
Training cycles 5 x 9103 bars (78 weeks)
Montecarlo cycles 200
Simulation mode Realistic (slippage 0.0 sec)
Avg bar 9.0 pips range
Spread 0.0 pips (roll 0.00/0.00)
Contracts per lot 1000.0
Gross win/loss 627$ / -505$ (+1393p)
Average profit 82.24$/year, 6.85$/month, 0.32$/day
Max drawdown -46.39$ 37.9% (MAE -47.85$ 39.1%)
Total down time 88% (TAE 31%)
Max down time 7 weeks from Dec 2015
Max open margin 2.56$
Max open risk 10.24$
Trade volume 575122$ (386798$/year)
Transaction costs 0$ spr, 0$ slp, 0$ rol
Capital required 68.46$
Number of trades 593 (399/year, 8/week, 2/day)
Percent winning 51.3%
Max win/loss 30.52$ / -11.34$
Avg trade profit 0.21$ 2.3p (+23.5p / -19.9p)
Avg trade slippage 0$ 0.0p (+0.0p / -0.0p)
Avg trade bars 5 (+5 / -5)
Max trade bars 7 (7 hours)
Time in market 39%
Max open trades 1
Max loss streak 8 (uncorrelated 9)
Annual return 120%
Profit factor 1.24 (PRR 1.11)
Sharpe ratio 1.44
Kelly criterion 1.73
R2 coefficient 0.864
Ulcer index 12.6%
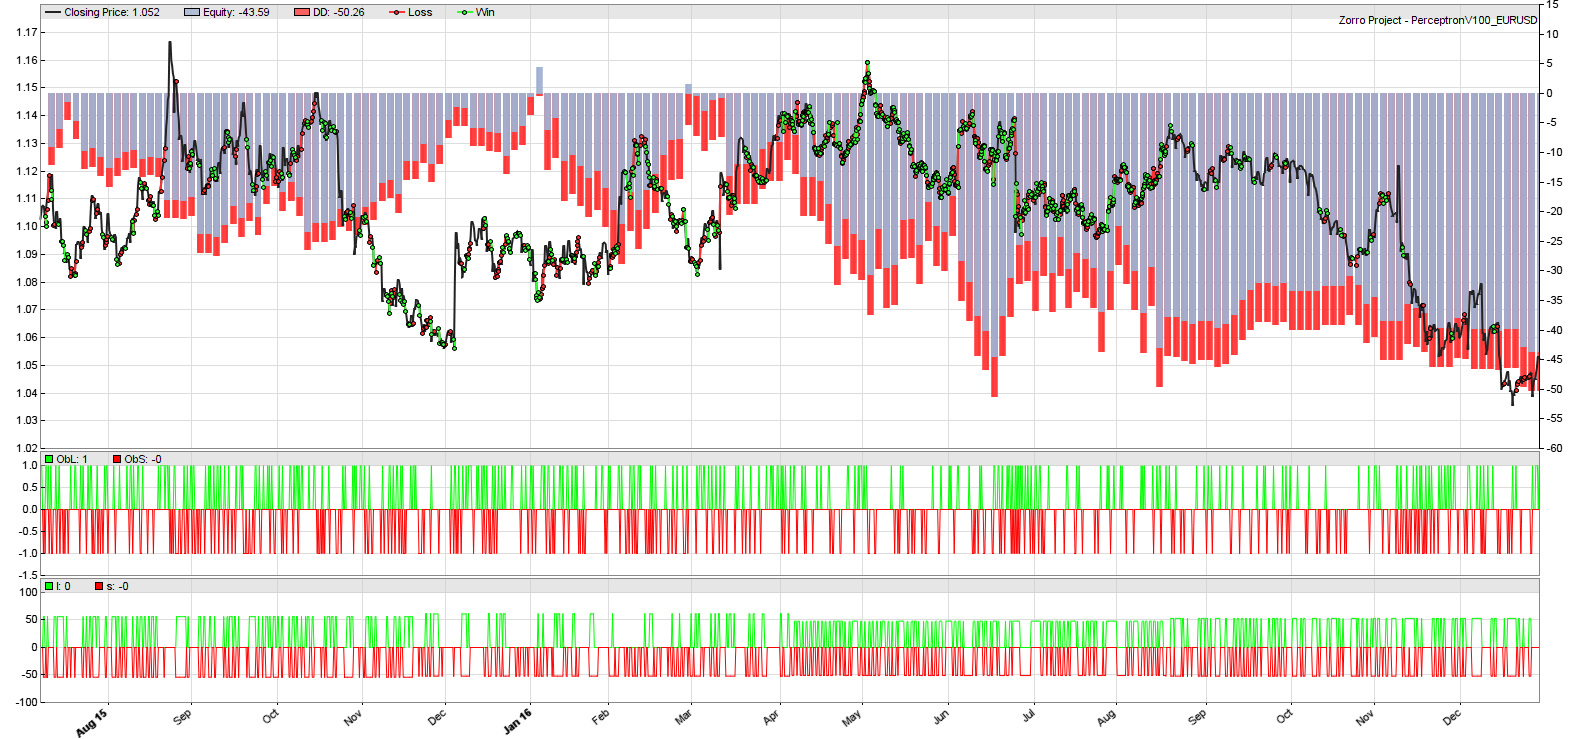
But if you change "LookBack" from 100 to 200, the result changes drastically:
Quote:
WFA Test PerceptronV100 EURUSD
Simulated account AssetsFix
Bar period 1 hour (avg 86 min)
Simulation period 2014-01-14..2016-12-30 (18108 bars)
Test period 2015-07-08..2016-12-30 (9055 bars)
Lookback period 200 bars (12 days)
WFO test cycles 4 x 2263 bars (19 weeks)
Training cycles 5 x 9053 bars (78 weeks)
Simulation mode Realistic (slippage 0.0 sec)
Avg bar 9.1 pips range
Spread 0.0 pips (roll 0.00/0.00)
Contracts per lot 1000.0
Gross win/loss 551$ / -594$ (-497p)
Average profit -29.43$/year, -2.45$/month, -0.11$/day
Max drawdown -60.19$ -138.1% (MAE -64.42$ -147.8%)
Total down time 99% (TAE 39%)
Max down time 23 weeks from Jan 2016
Max open margin 2.54$
Max open risk 10.17$
Trade volume 759622$ (512850$/year)
Transaction costs 0$ spr, 0$ slp, 0$ rol
Capital required 88.20$
Number of trades 777 (525/year, 11/week, 3/day)
Percent winning 50.1%
Max win/loss 10.58$ / -14.76$
Avg trade profit -0.0561$ -0.6p (+16.1p / -17.4p)
Avg trade slippage 0$ 0.0p (+0.0p / -0.0p)
Avg trade bars 5 (+5 / -5)
Max trade bars 7 (7 hours)
Time in market 46%
Max open trades 1
Max loss streak 7 (uncorrelated 10)
Annual return -33%
Profit factor 0.93 (PRR 0.84)
Sharpe ratio -0.54
Kelly criterion -0.89
R2 coefficient 0.555
Ulcer index 100.0%
The Trades / Signals (Output) of the Perceptron are also very different.
Why is that?
