Can't plot daily high & low

Posted By: vivaldi2

Can't plot daily high & low - 10/09/19 17:35

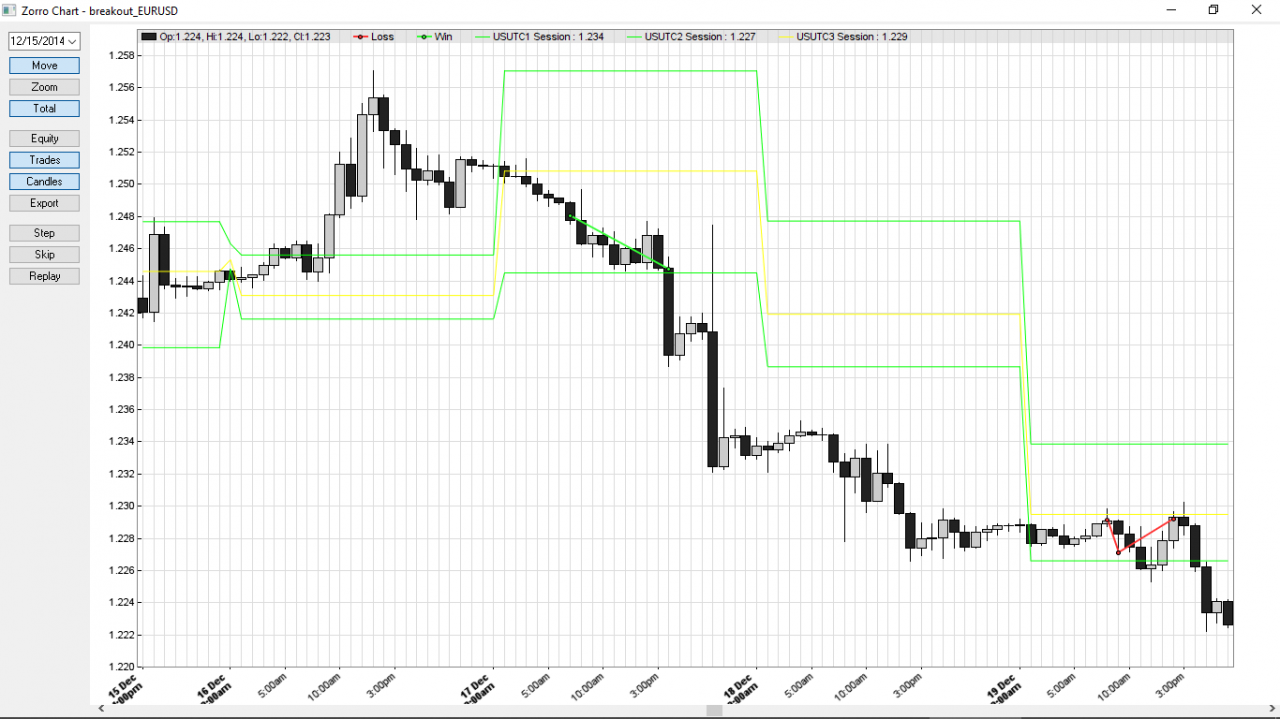
I am trying to plot yesterday high and low, but it return something different :
Code
function run()
{
	
	BarPeriod = 30;
	LookBack  = 0;
	
	
	asset("EUR/USD");


var session_high = dayHigh(UTC,1); //
var session_low = dayLow(UTC,1); // 
var session_pivot1 = dayPivot(UTC,1); // 


plot("USUTC-1 Session High Price", session_high, MAIN, GREEN); 
plot("USUTC-2 Session Low Price", session_low, MAIN, GREEN); 
plot("USUTC-3 Session Pivot", session_pivot1, MAIN, YELLOW); 

}

what is wrong with my code ?
Posted By: Spirit

Re: Can't plot daily high & low - 10/10/19 08:56

Code looks ok, what is wrong with the plot?
Posted By: vivaldi2

Re: Can't plot daily high & low - 10/10/19 13:49

Look at the screenshot, the high and low of yesterday ( green lines ) is not true .

Attached picture Screenshot 2019-10-10 17.16.15.png
Posted By: Spirit

Re: Can't plot daily high & low - 10/11/19 11:04

Why is it not true?
Posted By: Junker

Re: Can't plot daily high & low - 10/13/19 16:16

I agree with @vivaldi2. i am learning this now and i used the same formula but applied to 1 minute and in ET timezone.
my understanding of dayLow is that it gets the yesterday's lowest price of the day and dayHigh gets the yesterdays highest price for the day.

The day high seems to be working properly. but the day low is not.

[Linked Image]

formula i used is as below
Code
function run()
{
	
	BarPeriod = 1;
	LookBack  = 0;
	
	
	asset("EUR/USD");


var session_high = dayHigh(ET,1); //
var session_low = dayLow(ET,1); // 
var session_pivot1 = dayPivot(ET,1); // 


plot("USUTC-1 Session High Price", session_high, MAIN, GREEN); 
plot("USUTC-2 Session Low Price", session_low, MAIN, GREEN); 
plot("USUTC-3 Session Pivot", session_pivot1, MAIN, YELLOW); 

}
Posted By: AndrewAMD

Re: Can't plot daily high & low - 10/13/19 20:04

Why did you set your lookback to 0 when your indicator is looking back?
Posted By: Junker

Re: Can't plot daily high & low - 10/13/19 23:51

i took away @vivaldi2 thread. so cannot comment.
However, i removed the lookback and still get the same result.

my guess is that this formula is ignoring prices before 9.30 EST which is the US trading hours. How can i make it look at 24 hour charts x 5 days as the forex works that way?

[Linked Image]

Code
function run()
{
	
	BarPeriod = 30;

	
	asset("EUR/USD");


var session_high = dayHigh(ET,1); //
var session_low = dayLow(ET,1); // 
var session_pivot1 = dayPivot(ET,1); // 


plot("USUTC-1 Session High Price", session_high, MAIN, GREEN); 
plot("USUTC-2 Session Low Price", session_low, MAIN, GREEN); 
plot("USUTC-3 Session Pivot", session_pivot1, MAIN, YELLOW); 

}
Posted By: jcl

Re: Can't plot daily high & low - 10/14/19 13:52

It's not a day. It's a market day. Read the manual. Forex has sessions, but I don't think it has a "daily high & low".
Posted By: Zheka

Re: Can't plot daily high & low - 10/14/19 18:39

You have to set Start/EndMarket explicitly to the times you need, or Zorro will use default values. You better do it for most of the vars yourself, not to waste time debugging unexpected results.

Doing this, you should keep in mind that:

1) Start/EndMarket are in "local market time" (while vars like StartWeek/EndWeek and Zorro's internal time are UTC)
2) setting StartMarket>EndMarket (e.g. start:1705- end:1700) which is the case for FX and futures - will not work out of the box. You will have to code around.

3) values you specify in these vars are EXCLUSIVE of that time, i.e. setting EndMarket=1700 will NOT include the bar ending 1700.

4) StartWeek/EndWeek work in 1hr increments.
Posted By: felixfx

Re: Can't plot daily high & low - 10/24/19 02:01

this is how I would personally do it if you're plotting a rolling high and low of the day:

function run()
{

BarPeriod = 30; // you're using 30 minutes
vars Close = priceClose();

int period = 48; // 30 minutes * 48 is 24 hours
vars high = series(MaxVal(Close, period);
vars low = series(MinVal(Close, period);

plot("high", high, MAIN, BLUE);
plot("low", low, MAIN, RED);

}
© 2024 lite-C Forums