New plots not showing correctly with various "PlotMode"

Posted By: 3dvg

New plots not showing correctly with various "PlotMode" - 09/17/20 22:08

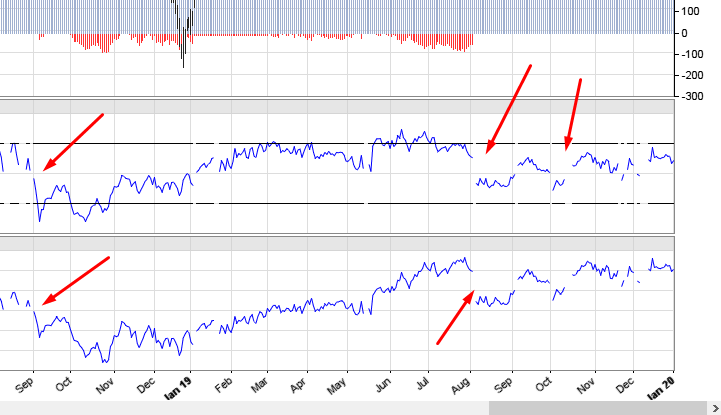
Hi, I was testing out the different PlotModes and the only one that shows the new plots correctly is the PL_ALL.

I have attached an image with setf(PlotMode, PL_ALL); (works well) >> pl_all.png

And another one with PL_LONG, PL_ALLTRADES, PL_FINE, PL_DIFF, PL_BENCHMARK and not setting "setf(PlotMode, {whatever PL});" >> pl_rest.png

Does anyone know why this happens? I have been reading https://manual.zorro-project.com/plotmode.htm
And if I do setf(PlotMode,PL_ALL+PL_FINE); works well, im assuming its because it's using PL_ALL.
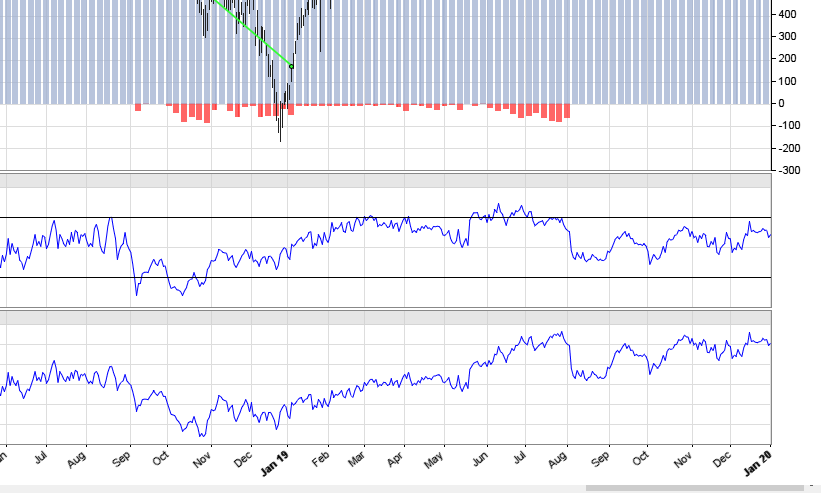
Attached picture pl_all.png
Attached picture pl_rest.png
Posted By: danatrader

Re: New plots not showing correctly with various "PlotMode" - 09/17/20 23:38

Is it a single instrument strategy?

Otherwise maybe:

https://manual.zorro-project.com/plotmode.htm

If plot is called several times with the same Name in the same run cycle, only the last data value is plotted. If a plot command is not called during a bar, the plotted curve will have gaps at the skipped bars. This can be used for plotting dotted lines.
Posted By: 3dvg

Re: New plots not showing correctly with various "PlotMode" - 09/18/20 06:34

It's a multi-instrument strategy (2 instruments) .

Are you suggesting that by using this
Code
setf(PlotMode,PL_ALL+PL_FINE);
... PL_ALL will go to first instrument loaded and PL_FINE to the second isntrument ?

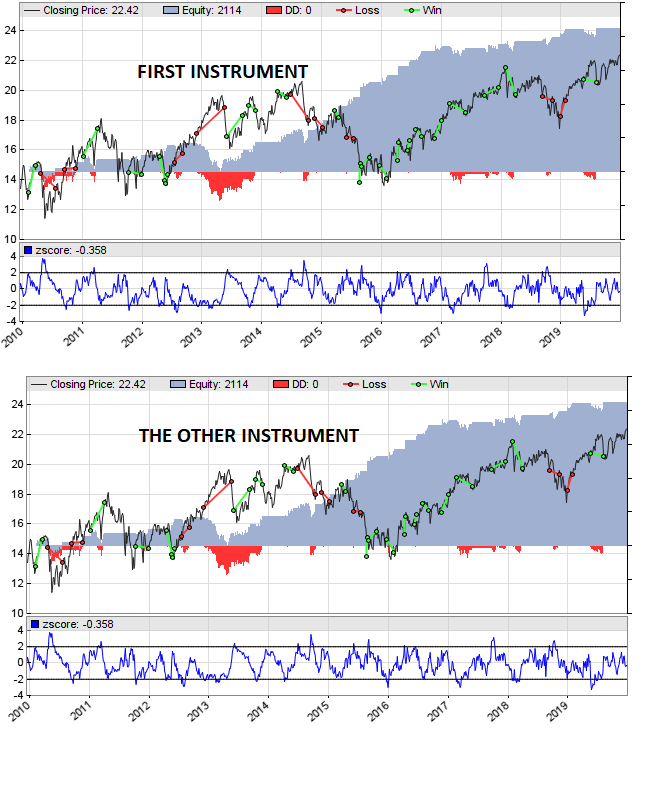
Also another question, Is there a way to display both instruments on the same results window? It's a pairs trading strategy.
Posted By: danatrader

Re: New plots not showing correctly with various "PlotMode" - 09/18/20 11:22

Not sure, I am suggesting PL_ALL draws it all.
PL_FINe only for the selected Asset.

https://manual.zorro-project.com/plotmode.htm
Any plot command is normally linked to the current asset. When multiple assets are traded, only prices, trades, and curves linked to the asset selected with the [Asset] scrollbox are plotted; curves linked to other assets are only plotted when PlotMode got set to PL_ALL. For plotting parameters of different assets together, store them in different variables and then plot all together without calling asset() inbetween. For instance, inside an asset loop you can store them in a var array with one element per asset, then plot all elements of the array after the asset loop. The curves are then visible on the chart when you select the last asset of the loop and click [Result].

Not sure if it is right, since you don't post code.

You can draw something like that.

char name[40];
strcpy(Asset,Asset);
var equity = EquityShort+EquityLong;
plot(Asset,equity,MAIN,color(random(100), RED, BLACK, BLUE, YELLOW, ORANGE, PURPLE, MAROON, LIGHTBLUE));
Posted By: 3dvg

Re: New plots not showing correctly with various "PlotMode" - 09/18/20 11:52

Not sure what you mean with the lines of code you posted.

Here's the code. I have also attached a screenshot of what I would like to see... Showing the subplots is not necessary, I just want to have both instruments showing their respective trades.


Code
#define Y "EWC"
#define X "EWA"


function run()
{
    set(PLOTNOW);
    setf(PlotMode, PL_ALL + PL_FINE);
    StartDate = 20100101;
    EndDate = 20200101;
    BarPeriod = 1440;
    LookBack = ZSLookback;
    MaxLong = MaxShort = MaxTrades;
    
    if(is(INITRUN)) {
	  string Name;
	  while(Name = loop(Y, X)){
			assetHistory(Name, FROM_AV);
	  }
    }
    

// -------------------------------
// PLOTS 
// -------------------------------  
	plot("zscore", ZScore, NEW, BLUE);
	plot(strf("#upLevel"), 2, 0, BLACK);
	plot(strf("#downLevel"), -2, 0, BLACK);
	
}


Attached picture IDEA.png
Posted By: danatrader

Re: New plots not showing correctly with various "PlotMode" - 09/18/20 12:10

I assume then you need to use

PL_FILE - export the chart to a .png image, rather than opening the chart viewer. The file name is composed from the script name, an optional asset name, and the LogNumber.
© 2024 lite-C Forums