Posted By: Phantom377
plot: PLOTNOW, plot(), enterLong() - 05/31/21 00:00
Hi All
I am new, sorry for my basic questions.
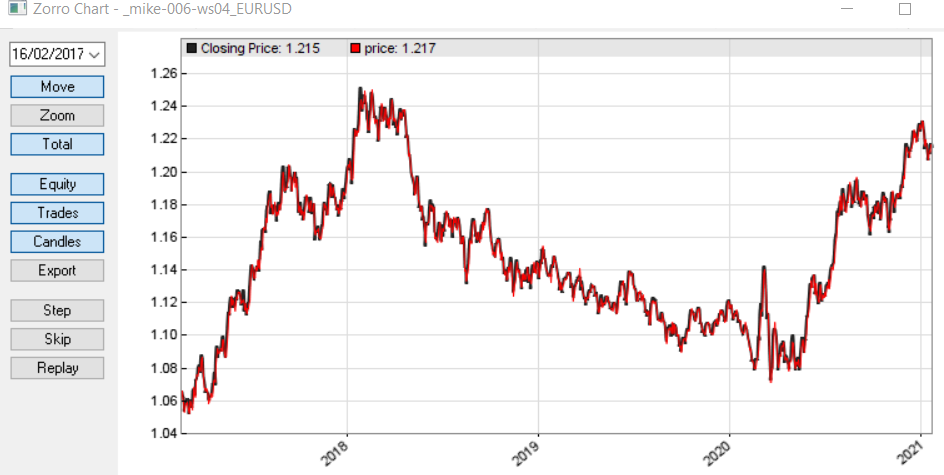
this works as expected: it creates a plot 1
set(PLOTNOW);
set(LOGFILE);
vars Prices = series(price(0));
plot("price", price(), MAIN, RED);
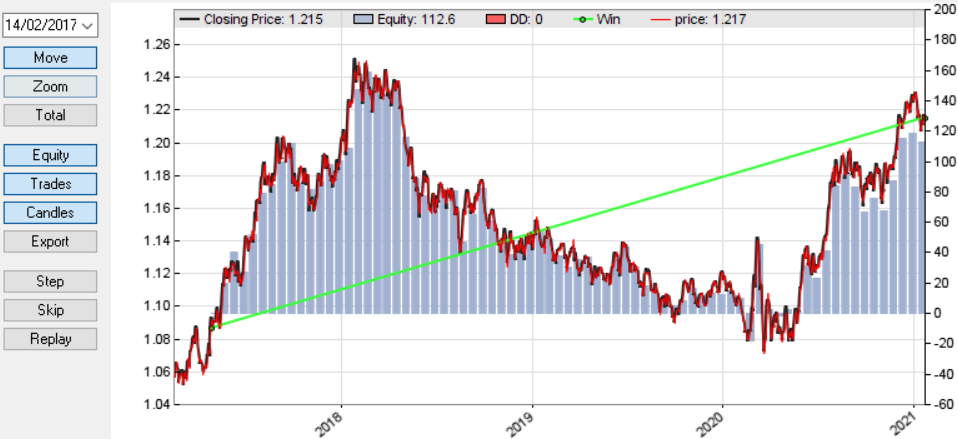
If I add some more lines, it creates on the chart additional plots I have not asked for (plot 2)
function run()
{
set(PLOTNOW);
set(LOGFILE);
vars Prices = series(price(0));
plot("price", price(), MAIN, RED);
vars Trends = series(LowPass(Prices,500));
hours or aligning to the end of day.
Stop = 4*ATR(100);
var delta = ATR(100) - ATRS(100);
printf("delta = %f; ", delta);
vars MMI_Raws = series(MMI(Prices,300));
vars MMI_Smooths = series(LowPass(MMI_Raws,300));
if(falling(MMI_Smooths))
{
if(valley(Trends))
enterLong(); // for some reason (beause of set(plotnow) this part is ploted even if I am not asking for plotting them
else if(peak(Trends))
enterShort(); // for some reason (beause of set(plotnow) this part is ploted even if I am not asking for plotting them
}
}
My understanding is that the combination "set(PLOTNOW)" + "valley(Trends)" or "peak(Trends)" is sufficient for generating the additional plots.
How do I have to code for plotting only what I want?
How to change the above code for plotting "price" but not the part into the "if"
Thanks