Posted By: rvl
plot and calculate signal only during regulate trading hours - 07/23/23 03:31
hello all,
After 2-weeks researching different Algo platforms to settle on, and like Zorro capacities and bought the S license.
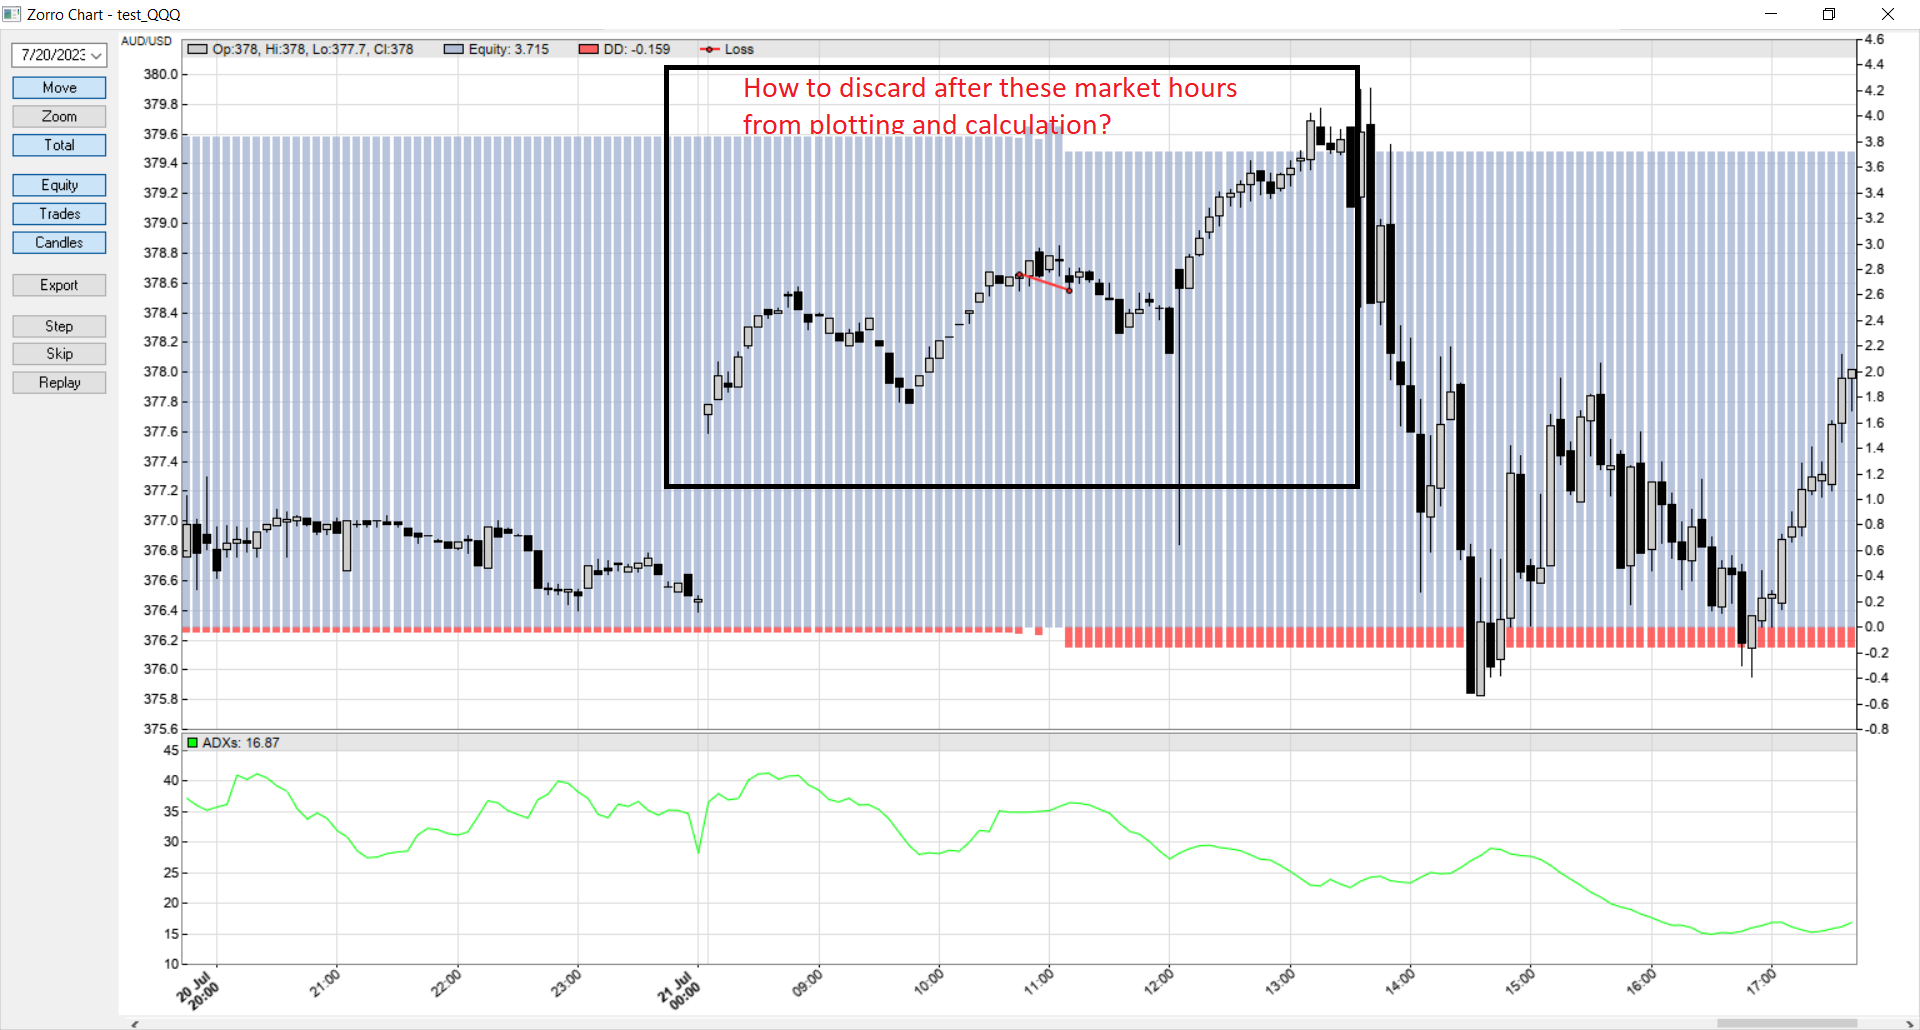
Anyway, I'm still having a little hard time understanding BarZone and BarMode concepts even afer reading some posts on here. Basically, I have TICK t1 data from Sierra Chart in EST timezone, I want to plot and calculate ADX/ATR/etc only for the bars in regular trading hours only, discarding after-hours bars, but the plot still shows after-hours bars. My snippet is below, appreciate any help.
set(TICKS);
History = "History\\_2023.t1";
set(LOGFILE);
//series()
asset("QQQ");
//ADXs = series(ADX(20),20);
BarZone = UTC;
AssetMarketZone = EST;
AssetMarketStart = 0930;
AssetMarketEnd = 1600;
BarMode = BR_WEEKEND | BR_LOCAL | BR_MARKET;
//TickTime = 1;
LookBack = 80;
BarPeriod = 5;
StartDate = 20230710;
EndDate = 20230721;
StartMarket = 1330;
EndMarket = 2000;
