Posted By: AdamWu
plotHeatmap is not working - 07/29/20 22:47
Hi I was using the exact code of manual to plot assets correlation heat map:
Manual
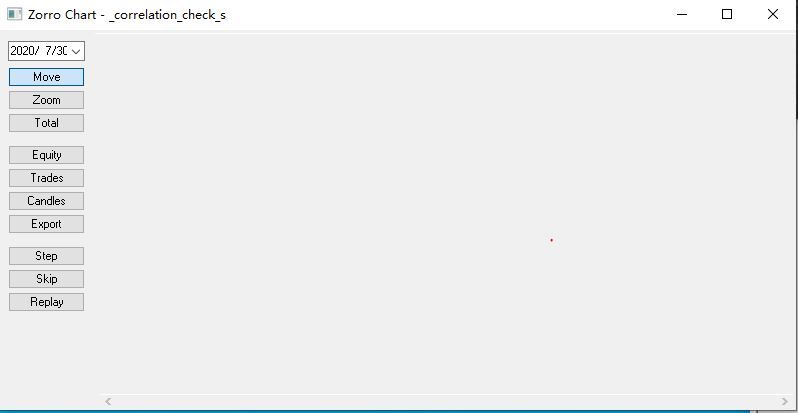
But it olny shows a blank plot, have a look at the attachment.
And there is no warning/error message in the console:
_correlation_check compiling................
Test: _correlation_check 2015..2020
Some info:
Zorro version: 2.25
Broker: FXCM (demo)

Manual
Code
#define DAYS  252 // 1 year
#define NN    30  // max number of assets
#include <profile.c>
// plot a heatmap of asset correlations
function run()
{
  BarPeriod = 1440;
  StartDate = 20150101;
  LookBack = DAYS;

  vars Returns[NN];
  var Correlations[NN][NN]; // NN*NN matrix
  int N = 0;
  while(asset(loop("USD/CAD","EUR/USD","GBP/USD")))
  {
    Returns[N] = series((price(0)-price(1))/price(0));
    N++; // count number of assets
  }

  int i,j;
  if(!is(LOOKBACK)) {
    for(i=0; i<N; i++)
      for(j=0; j<N; j++)
        Correlations[N*i+j] = Correlation(Returns[i],Returns[j],DAYS);

    plotHeatmap(Correlations,N);
    quit("");
  }
}
But it olny shows a blank plot, have a look at the attachment.
And there is no warning/error message in the console:
Quote
_correlation_check compiling................
Test: _correlation_check 2015..2020
Some info:
Zorro version: 2.25
Broker: FXCM (demo)
